A tale of my journey through the world of video game data.
Definitely Gaming for Scientific Reasons: Exploring Game Data
If there's one thing I love more than refusing to defeat the final boss in the games I play, it's analyzing data about those games. (Alright, that's a lie; nothing can beat procrastinating in a fictional world.) So, here's my not-so-scientific adventure in game data exploration. Sit back, grab a controller and/or caffeinated drink, and join me as I dig into the questions no one asked - like, "Which month hates game releases the most?" and "Are action games truly the best?"
(I’m sorry, but there’s no synonyms for ‘game’ in this sense that I can find. So bear with me.)
The Question
I wouldn’t consider myself a Gamer™ (derogatory), but I do love playing video games. My Nintendo Switch and I have spent quite a bit of time together. (I’m a fan of Pokémon, LoZ: BotW, Celeste, and Omori in particular. Not that you asked.)
When I was looking for datasets to collect, I came across the Moby Games website (a site for collecting and managing game information) and thought ‘why not?’. I was curious to see what attributes give games higher ratings than others; does the type of genre or interface make a difference? Were there more popular games released in a particular year? What impact did COVID-19 have on games (if any)? And the like. Not anything I think about on a daily basis, but worth looking into.
The Ethics
Before you ask - yes, I did check the robots.txt file. It allowed me to access all the content I needed. Since I didn’t extract any names or personal info, I figured it’d be alright to share my data on the GitHub repository. If you happen to be the esteemed Moby of Moby Games and would like me to terminate my repo, email me.
And don’t worry, I was very nice with my scraping. I set a 3-5 second delay with every url my program followed, so it took about an hour to collect everything. I do appreciate and respect your website, Moby Games.
The Steps
Grabbing the first part of the data was easy, especially since it was a table - just same basic BeautifulSoup coding and I had it. But the second part was quite a nuisance. It was technically a grid object, but the find functions could not fulfill their one purpose in life. <dd> and <dl> tags don’t like cooperating, apparently. So ChatGPT and I talked over dinner, and breakfast, and lunch… we chatted (well, mostly I pleaded for help and it patiently responded) for hours to figure out how to extract the data I wanted.
Once that was figured out, I had to do something even worse: clean the data. Honestly, it was a nightmare. Whitespace, parentheses, commas, slashes, lions, tigers, and bears - I needed to clear out almost everything. Simple, right? Yes, but I also needed to turn each value in most of my columns into lists. Rather than ‘Fantasy, Sci-fi / futuristic”, I wanted [Fantasy, Sci-fi / futuristic] so I could properly analyze the data.
This is what that code looked like:
games_df_clean = games_df.copy()

#Clean specific columns using .apply()
games_df_clean['Released'] = games_df['Released'].apply(clean_released_date)
games_df_clean['Critics'] = games_df['Critics'].apply(clean_value).apply(clean_critics)
games_df_clean['Gameplay'] = games_df['Gameplay'].apply(lambda x: clean_and_split(x) if isinstance(x, str) else x)
games_df_clean['Setting'] = games_df['Setting'].apply(lambda x: clean_and_split(x) if isinstance(x, str) else x)
games_df_clean['Perspective'] = games_df['Perspective'].apply(lambda x: clean_and_split(x) if isinstance(x, str) else x)
games_df_clean['Interface'] = games_df['Interface'].apply(lambda x: clean_and_split(x) if isinstance(x, str) else x)

#Split the 'Genre' column based on commas and remove extra spaces
basic_games_df['Genre'] = basic_games_df['Genre'].apply(clean_genres)
Where clean_and_split, clean_released_date, clean_date are functions previously defined to, unsurprisingly, clean the data. You can find those in my code in Github.
I’ll spare you the rest of those details. Luckily for you, if you’re interested in scraping a similar website, you have (stupidly complicated) code in the repo linked at the bottom. Congrats.
Then the still-hard-but-not-as-bad part: EDA. Gotta say, it’s incredibly annoying that R is so similar to Python but has different syntax - I can create plots just fine in R, but I struggle a bit in Python. With the help of my dear friend ChatGPT, I eventually got through it.
So, without further ado: the dataset.
The Dataset
Unfortunately, my dataset is only games from the Nintendo Switch, and I couldn’t exactly grab the 11,774 games on the master list before Moby drop-kicked me out of their servers. So I ended up with 550 games and collected 12 features:
- Title
- Release year
- Release date
- Moby Score (Ranking)
- Critics Score (Percentage)
- Genre
- Puzzle, Racing/Driving…
- Perspective
- 1st-Person, Behind view…
- Gameplay
- RPG, Platform…
- Interface
- Point and Select, Direct control…
- Setting
- Fantasy, Western…
- ESRB Rating
- Multiplayer Options
After checking for missing values, I dropped the last two columns - they were missing 361 and 444 values, respectively, out of 550 total.
Why did I keep ‘Release year’ and ‘Release date’? Well, I collected the year before finding out about the date variable. I also wanted months, so I just grabbed the release date as well.
Having retrieved the dataset, I moved on to the summary stuff.
The Stats
Now for the exciting part: summary statistics.
The Numerical Stuff
The only numeric variables I had were the Moby Score and the Critics rating.
all_combined_df.describe()

            Score     Critics
count  550.000000  550.000000
mean     8.023273   84.336364
std      0.257217    3.365087
min      7.800000   77.000000
25%      7.900000   82.000000
50%      7.900000   84.000000
75%      8.100000   86.000000
max      9.400000   96.000000
Not particularly interesting, besides the sheer number of 0’s the function felt the need to add. The relatively high scores are par for the course, seeing as I took the top 550 games from the list, which was organized by Moby Score.
The Categorical Stuff
Now for our first categorical variable: release year!
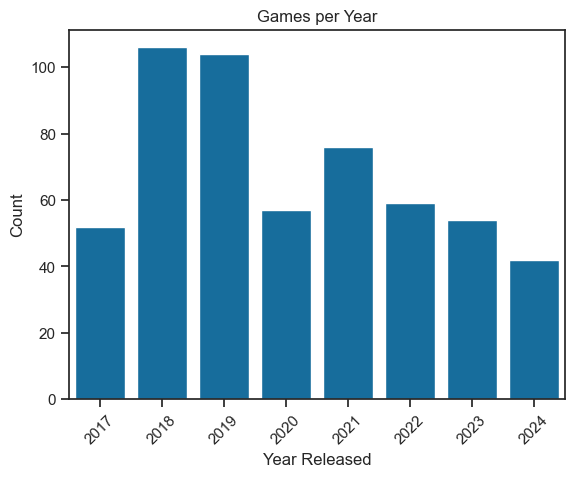
Well, that was underwhelming. The counts of the rest of the categorical variables look very similar to this, as can be expected. Instead of just inserting the count plot for every variable, I wanted to show you a couple comparison graphs. (Honestly, I just wanted to actually compare some of the variables I looked at because I spent a heckin’ long time on data collection.)
This one is fun. I’ll include the code for it as well:
##Stacked DataFrame

#Group the data and create a stacked DataFrame
exploded_df = all_combined_df.explode('Genre').reset_index(drop = True) #.explode is used to separate out cells with multiple values into new rows
data = exploded_df.groupby(['Year', 'Genre']).size().reset_index(name='Count')

#Create the stacked area chart
fig = px.area(data, x='Year', y='Count', color='Genre',
              title='Games Released by Genre over Time',
              labels={'Year': 'Year', 'Count': 'Number of Games'},
              template='plotly')

fig.update_layout(margin=dict(l=0, r=0, t=40, b=40))
fig.show()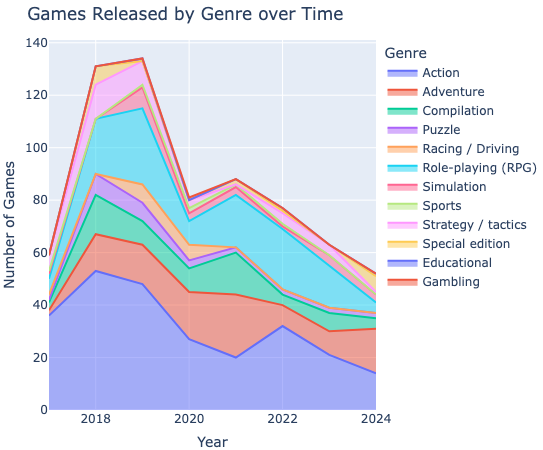
If you’re unfamiliar with stacked area plots, they’re pretty simple - the one with the largest area has the most counts. In this case, ‘Action’ (the blue one) has the most games of all the genres. Then each other genre is stacked on top of it until the total count for the year is reached. For example, in 2018 in this dataset, there were approximately 50 Action games released, 10 Adventure games released, etcetera.
(Note the substantial dip in 2020 from both of these graphs. Unsurprising, but still neat to look at.)
I actually made six plots to use in the post, but I figured that might be too much. So here’s the last one:
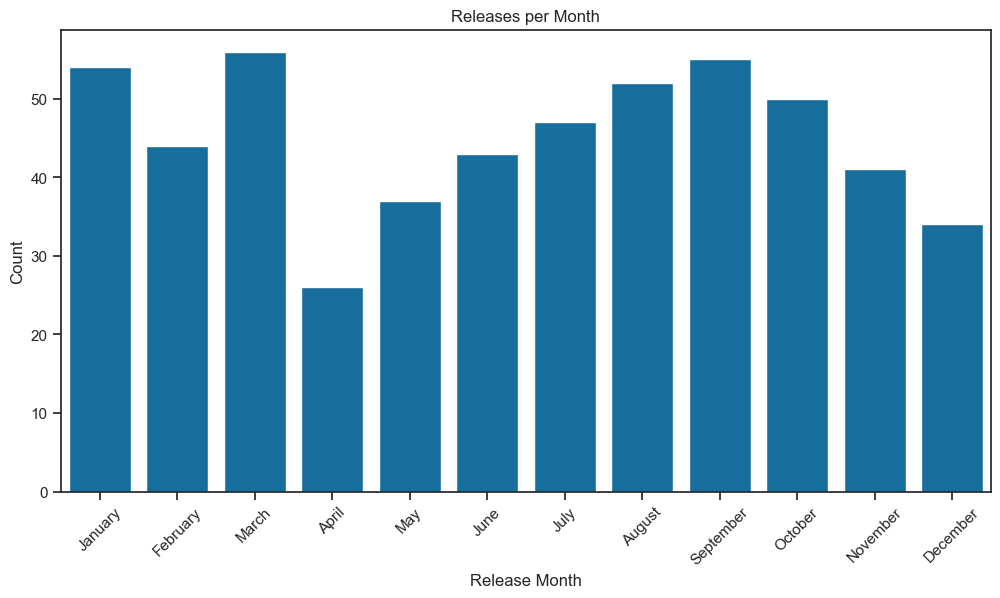
It seems like April is just a lame month for game releases in my dataset.
Anyways, that was a little bit of EDA for you to snack on. By all means, if you’re curious, go check out the dataset on my GitHub.
The Finish (The Flag, if you will)
In the end, while my glance into the world of Nintendo Switch game data didn’t turn me into a data wizard or an official Gamer™, it did give me a peek into the patterns behind the games I (and many others) love. From genre trends over time to release schedules that avoid April like the plague, every stat and visualization helped paint a bigger picture of what’s happening in gaming. So, while this may not be groundbreaking scientific research, it was pretty entertaining (and incredibly frustrating - just like a platformer). And if anyone asks, I was just gaming… for science. Wow, that was incredibly cheesy.
As for you - go take a look at the data and see if your favorite game (or just a game you know) made it on the list. Or maybe try making a plot of Setting versus Perspective and see if there’s anything interesting. I dunno, have a smidgen of fun with it.
(Like, Comment, and Subscribe?)